The receiver operating characteristic (ROC) curve is a measure of diagnostic efficiency, which is obtained by graphically plotting a series of true positive rates (sensitivity) against false positive rates (1 – specificity) for a binary outcome system. The ROC curve is a method to visualize the performance of a test with binary outcomes (+ / -) graphically.
The area under the ROC (AUROC) curve is equal to the probability that a randomly chosen patient with a confirmed diagnostic efficiency of a disease (eg., MRI +ve) will have a higher test value than a randomly chosen patient without the disease (MRI -ve).
The AUROC is useful to (1):
- evaluate the discriminatory ability of a test to correctly identify diseased and non-diseased individuals.
- find optimal cut-point to least misclassify diseased and non-diseased individuals.
- compare the efficiency of two or more tests to diagnose the same disease.
- compare the efficiency of two or more examiners diagnosing the same disease.
We have to choose parametric or non-parametric methods to calculate AUROC.
The parametric methods are used when test outcomes in both diseased and non-diseased individuals have a normal distribution. The AUROC using parametric methods are calculated using statistical software (2).
When there is non-normal distribution, we can use non-parametric methods to calculate AUROC. There are two non-parametric methods currently in use.
- The method using trapezoidal rule explained elsewhere (1) is calculated using statistical software.
- The method using Mann-Whitney statistic (also called Wilcoxon Rank Sum statistic) and the C-index. The Wilcoxon statistic ‘W’ can be calculated by hand to produce a smooth ROC curve and the area under it along with the standard error, SE(W) (2).
We will use data from a peer-reviewed article on SLR test outcomes to calculate AUROC (3).
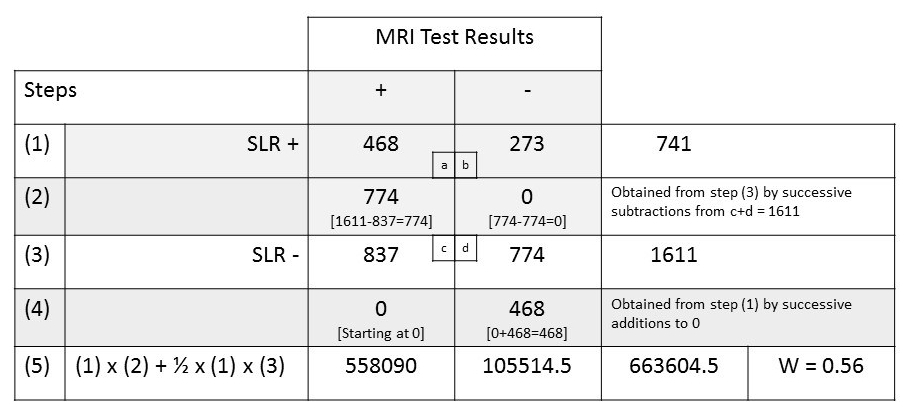
The ‘W’ statistic = 0.56 = 56% calculated in this way agrees exactly with AUROC calculated by the method using trapezoidal rule. The AUROC estimated by maximum likelihood technique (4) and method explained by Swets et al (5) will be slightly higher. The slightly lower AUROC estimated by ‘W’ or trapezoidal rule is on the conservative side.
References:
- Kumar, R. and Indrayan, A., 2011. Receiver operating characteristic (ROC) curve for medical researchers. Indian pediatrics, 48(4), pp.277-287.
- Hanley, J.A. and McNeil, B.J., 1982. The meaning and use of the area under a receiver operating characteristic (ROC) curve. Radiology, 143(1), pp.29-36.
- Capra, F., Vanti, C., Donati, R., Tombetti, S., O’reilly, C. and Pillastrini, P., 2011. Validity of the straight-leg raise test for patients with sciatic pain with or without lumbar pain using magnetic resonance imaging results as a reference standard. Journal of manipulative and physiological therapeutics, 34(4), pp.231-238.
- Dorfman, D.D. and Alf, E., 1969. Maximum-likelihood estimation of parameters of signal-detection theory and determination of confidence intervals—Rating-method data. Journal of mathematical psychology, 6(3), pp.487-496.
- Swets, J.A., 1979. ROC analysis applied to the evaluation of medical imaging techniques. Investigative radiology, 14(2), pp.109-121.