Clinicians often face complex diagnostic challenges. Such diagnostic dilemmas are typically complicated by the lack of clarity/focus during clinical investigation.
The application of the strategy called ‘Decision Analysis’, described by Pauker and Kassirer (1) will help estimate the probability of all possible outcomes in a diagnostic challenge and select an optimal course of action.
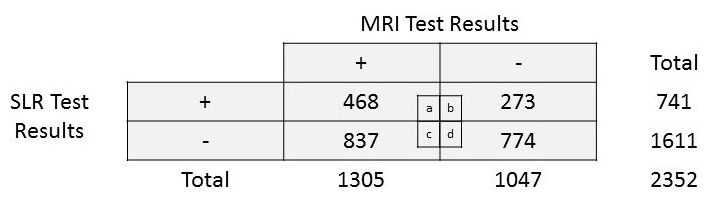
Let us consider data from the study by Capra et al (2) that evaluated the accuracy of straight leg raise (SLR) test in the diagnosis of lumbar disc herniation (LDH) compared with magnetic resonance imaging (MRI) results, to learn how to do decision analysis.
Step I: Create a decision tree (also called probability tree) with all possible outcomes.
Let us consider a 32-year-old male with low back pain (LBP) for the past one week, no related risk factors for sciatica but complains of diffuse radiating pain on the posterior aspect of his right leg. He has a full lumbar range of motion and normal passive accessory glides.
Based on the clinical investigation, let us consider non-specific LBP as the primary diagnostic hypothesis and assign 55.48% probability for a confirmed diagnosis of LDH as per actual prevalence (refer to Capra et al data (2)).
The prevalence of LDH in the study population (2) is calculated as follows:
[(a+c)/N] = [(468+837)/2352] = 0.5548 or 55.48%
To study if SLR test is useful in diagnosing LDH in this individual, we can plot a probability tree with all possible outcomes as below:
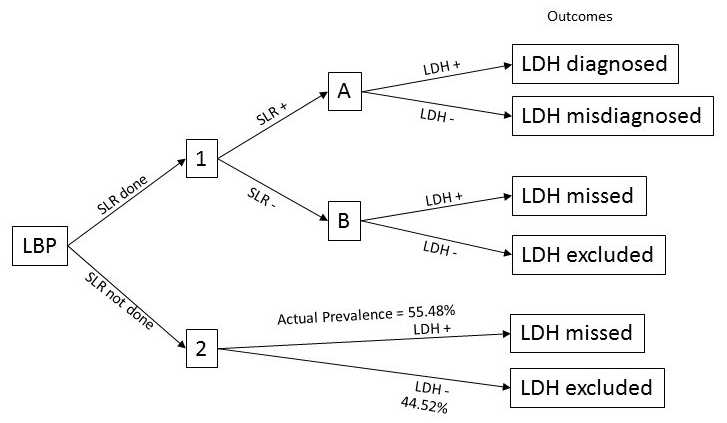
We now have two choices to make. We can either perform SLR in an attempt to confirm LDH instead of referring to MRI or skip the SLR test to proceed with MRI scan. If we do not perform SLR, we will not diagnose LDH for 55.48% of the time (actual prevalence in the population) but will be right in excluding LDH for 44.52% of the time.
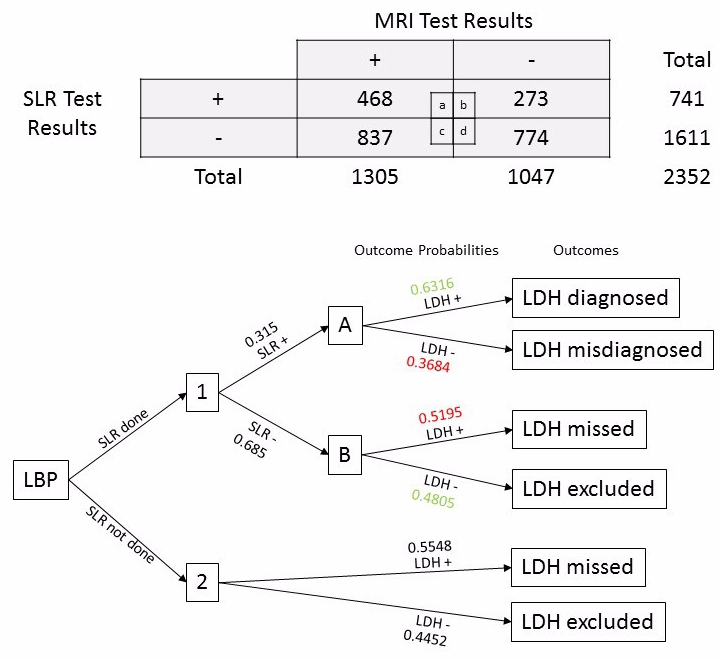
Step II: Assign probabilities for all outcomes.
Let us use data from Capra et al (2) to assign probabilities in our decision tree for all outcomes.
The proportion of patients with a positive SLR test will be
[(a+b)/N] = [(468+273)/2352] = 0.3150
The proportion of patients with a negative SLR test will be
[(c+d)/N] = [(837+774)/2352] = 0.6849
The proportion of patients with positive SLR test having confirmed LDH using MRI results will be [a/(a+b)] = [468/(468+273)] = 0.6316 (correct SLR test result)
The proportion of patients with positive SLR test having confirmed exclusion of LDH using MRI results will be [b/(a+b)]= [273/(468+273)] = 0.3684
The proportion of patients with negative SLR test having confirmed LDH using MRI results will be [c/(c+d)] = [837/(837+774)] = 0.5195
The proportion of patients with negative SLR test having confirmed exclusion of LDH using MRI results will be [d/(c+d)] = [774/(837+774)] = 0.4805 (correct SLR test result)
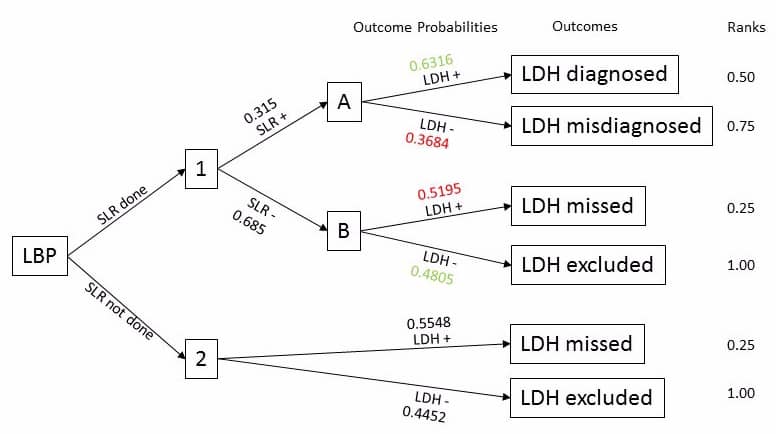
Step III: Assign a ranking number for the outcomes.
Let us rank each of the outcomes and assign them with a number. We have two scenarios – SLR done and SLR not done. Under each scenario, let us rank the outcomes based on its clinical advantage/benefit to the patient. I will rank the outcomes in order as follows:
- LDH excluded – this is ranked first because the patient does not have LDH! This is ideal for the patient. I will assign 1.0 for this outcome.
- LDH misdiagnosed – ranked second because the patient still does not have LDH, despite being misdiagnosed. I will assign 0.75 for this outcome.
- LDH diagnosed – ranked third because the patient has LDH and it is correctly diagnosed providing an opportunity for treatment. I will assign 0.50 for this outcome.
- LDH missed – ranked fourth because the patient has LDH but has been missed out and will not be receiving treatment. I will thus assign 0.25 for this outcome.
Step IV: Folding back by combining calculated probabilities and assigned ranking numbers.
Let us now multiply the assigned ranking numbers (1.0, 0.75, 0.50, 0.25) with the corresponding probabilities in each outcome. Next, sum up the products from each outcome for SLR + and SLR – separately. Repeat the same process at the next level. Note that you will be doing your calculations from right to left as below and that’s why this step is called ‘folding back’.
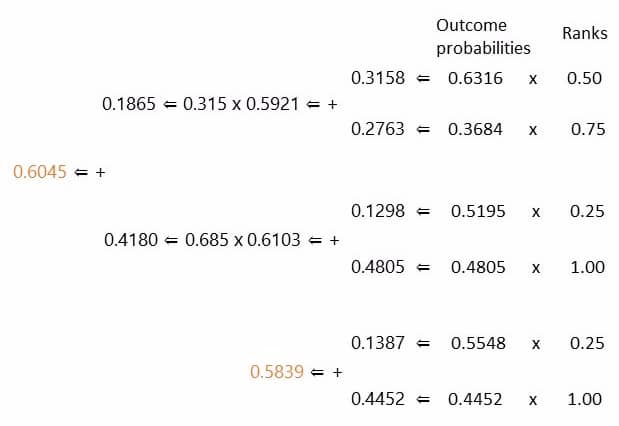
The expected advantage/benefit of not performing SLR test is 0.5839 or 58.39%.
The expected advantage/benefit of performing SLR test is 0.6045 or 60.45%.
Step V: Making a decision.
You should make a decision based on the expected probabilities we have calculated. The expected advantage/benefit of performing SLR test is higher (60.45%) than not performing SLR test (58.39%). So, the patients will benefit from performing the SLR test. However, the benefit is minimal.
Step VI: Testing your decision.
What if the pre-test probability (prevalence of LDH) in the population that you practice is different from what is reported in the study by Capra et al (2)?
What if the SLR test has a higher rate of missed or misdiagnosis?
To make a final decision on using the SLR test to diagnose LDH or not, you should consider the following points:
- You must use the prevalence of LDH from your local area for ‘decision analysis’.
- You must also check how the expected advantage/benefit of performing SLR changes with changes in the accuracy of the SLR test’s performance, eg., the rate of missed or misdiagnosis.
References:
1. Pauker, S.G. and Kassirer, J.P., 1980. The threshold approach to clinical decision making. New England Journal of Medicine, 302(20), pp.1109-1117.
2. Capra, F., Vanti, C., Donati, R., Tombetti, S., O’reilly, C. and Pillastrini, P., 2011. Validity of the straight-leg raise test for patients with sciatic pain with or without lumbar pain using magnetic resonance imaging results as a reference standard. Journal of manipulative and physiological therapeutics, 34(4), pp.231-238.