Let us continue our analysis using data from Capra et al (1).
After a confirmed MRI diagnosis, we may have the following questions:
- What is the probability that the patient with a positive MRI result has the disease? or
- What is the proportion of patients with positive MRI results have the disease?
Calculating the post-test probabilities (in other terms, post-test likelihood values or positive/negative predictive values) will help answer these questions. It is important to note that the predictive values (both positive and negative) are influenced by the true prevalence of disease in the total population that is being studied. A decrease in the disease prevalence will lead to an increase in the false positive results.
In the study by Capra et al (1), they had a large sample size but do not represent the actual prevalence of the disease. We should not calculate the predictive values when the study sample does not reflect true prevalence of the disease. However, we will use their data (assuming that their sample reflects the prevalence of the disease) to learn the effect of falling prevalence on the false positive results.
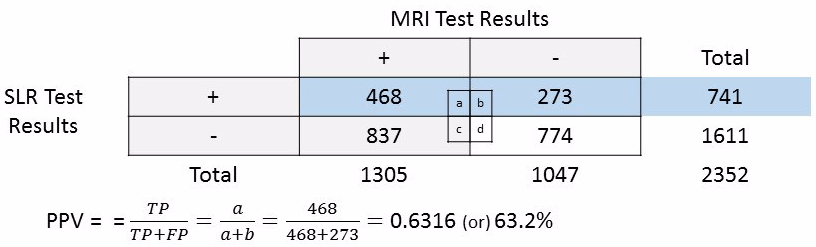
First, let us calculate the positive and negative predictive values from Capra et al (1) data holding our assumption true.
The positive predictive value (PPV) is the probability of having the disease when the MRI result is positive.
Table 1:
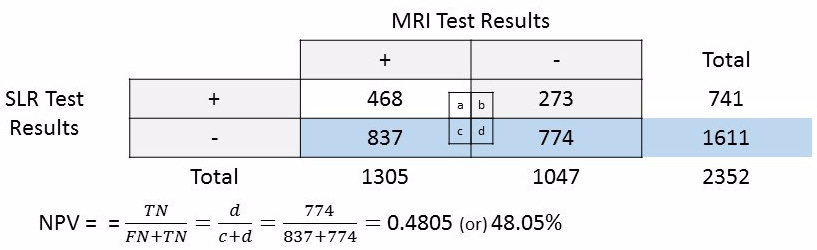
The negative predictive value (NPV) is the probability of not having the disease when the MRI result is negative.
Table 2:
Now, let us explore the impact of decreasing disease prevalence, assuming and holding sensitivity and specificity at 99% and 95% respectively for the Capra et al (1) data as explained by Dr.Chan Shah (2).
Table 3:
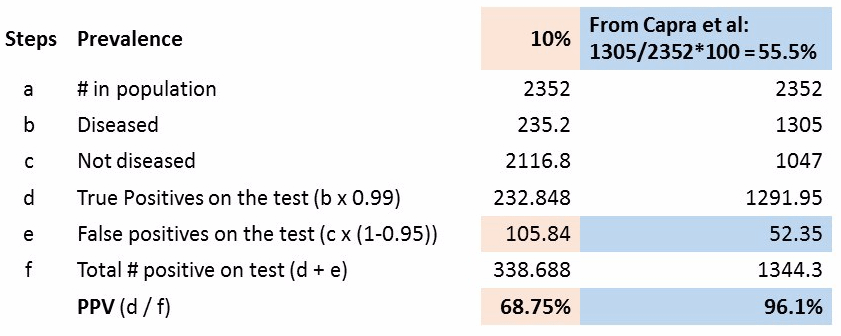
We find that the false positives on the test increase from 52.35 to 105.84 as the disease prevalence decreased from 55.5% to 10%.
ps. we are having a different PPV here (96.1%) in this calculation (table 3) compared to the previous PPV in table 1 (63.2%) as we are assuming sensitivity and specificity at 99% and 95% respectively for the Capra et al (1) data.
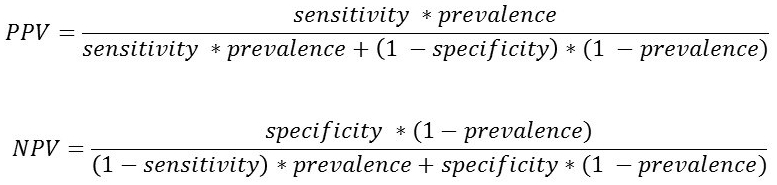
When the true prevalence of the disease under study is known, the positive and negative predictive values can also be calculated using the following formulae based on Bayes’ theorem (3-5):
References:
- Capra, F., Vanti, C., Donati, R., Tombetti, S., O’reilly, C. and Pillastrini, P., 2011. Validity of the straight-leg raise test for patients with sciatic pain with or without lumbar pain using magnetic resonance imaging results as a reference standard. Journal of manipulative and physiological therapeutics, 34(4), pp.231-238.
- Shah, C.P., 2003. Public health and preventive medicine in Canada. WB Saunders Company Canada Limited, 5th Edition.
- Altman DG, Machin D, Bryant TN, Gardner MJ (Eds) (2000) Statistics with confidence, 2nd ed. BMJ Books.
- Griner PF, Mayewski RJ, Mushlin AI, Greenland P (1981) Selection and interpretation of diagnostic tests and procedures. Annals of Internal Medicine 94:555-600.
- Zhou XH, NA Obuchowski, DK McClish (2002) Statistical methods in diagnostic medicine. New York: Wiley.